The Subway Action Plan is not making the subway better. Here's what is.
You subscribe to the free edition of Signal Problems which lands in your inbox every Friday morning. As you may have noticed, today is not Friday. This was a paid edition of Signal Problems I sent out a few weeks ago, but I’ve decided to share it with everyone. If you enjoy it, become a paid subscriber to get more like it every week.
On Sunday, the MTA issued a press release declaring “Continued Progress on Subway Action Plan,” which largely attributes a months-long gradual improvement in subway performance to the $836 million rescue plan “launched at the direction of Governor Andrew Cuomo in July 2017.” In that release, interim chairman Freddy Ferrer argues that we are just seeing the results of the 18-month old plan now because it has only recently been “fully funded.”
This story exemplifies common wisdom about why the subway got worse in the first place: that deferred maintenance due to lack of funding caused a spike in calamitous delays, known as “major incidents.” Yes, MTA funds were diverted, the agency was saddled with debt, and it was bad for the subway. Yes, the MTA wastes billions upon billions of dollars on mega-projects. And yes, deferred maintenance did lead to more delays. All of this is true. But it is not the full explanation for why the subway got so much worse, and it is not supported by the agency’s own performance data.
The subway slowly, gradually got worse over time because its leadership was unconcerned about the basics of running trains. When delays slowly mounted due to operational sloppiness, it sought PR strategies, not fixes. The subway is now slowly, gradually getting better not because of an influx of cash and work orders, but because it is finally addressing this erosion of subway basics.
We know this because of what’s happened over the last 18 months. To correct this budget and maintenance shortfall, in July 2017 the MTA launched the $836 million Subway Action Plan (SAP) intended to correct that maintenance backlog. Most observers thought this would help. But, for the most part, it didn’t. As I wrote for the Village Voice on its one-year anniversary:
“The unavoidable takeaway from current performance stats — not to mention the daily experience of riding the subway — is that we’re basically where we were a year ago; definitely not worse, maybe slightly better, but $836 million poorer.”
Don’t take my word for it. The Times, for example, also expressed skepticism the program accomplished much. Curbed NY likewise declared the improvements “only modest.”
The evidence simply wasn’t there, because the SAP was never targeting the source of the increased delays in the first place. Back in March, I wrote an article with the headline “Why the MTA’s ‘Subway Action Plan’ Won’t Fix Your Commute” based on internal NYCT delays data I had obtained which clearly showed the number of “major incidents” and other SAP targets had not changed over time.
Instead, delays of unknown causes had steadily mounted for years. We, the riding public, were all the proverbial frogs in the heating pot. Come 2017, a few high-profile incidents—not tremendously different in frequency than had occurred over the prior years, but dramatic and emblematic of a system-wide operational sloppiness—served as the metaphorical bubbles in the water that confirmed, yeah, you’re right, it has been getting awfully hot in here.
Rather than a lack of funding causing everything to break, the subway’s performance tanked because of a lack of focus on operational basics. It wasn’t so much a maintenance problem, but a management problem.
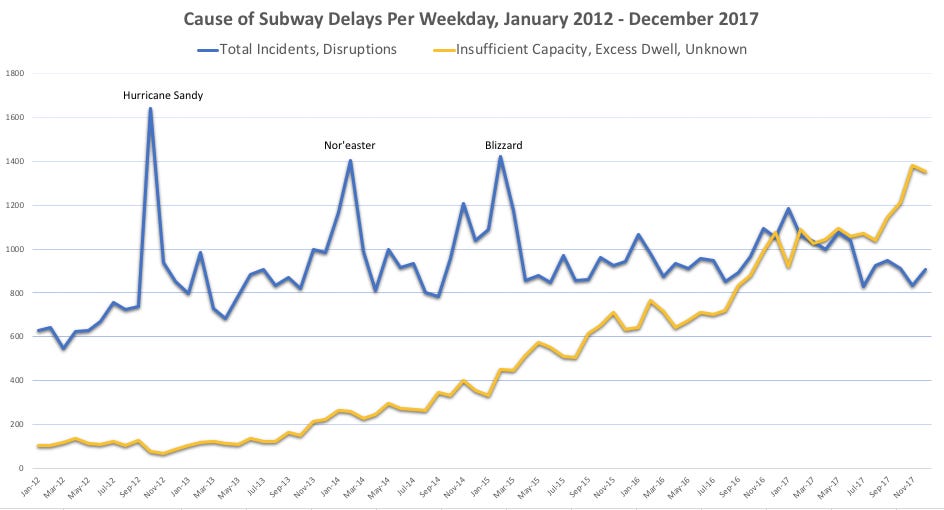
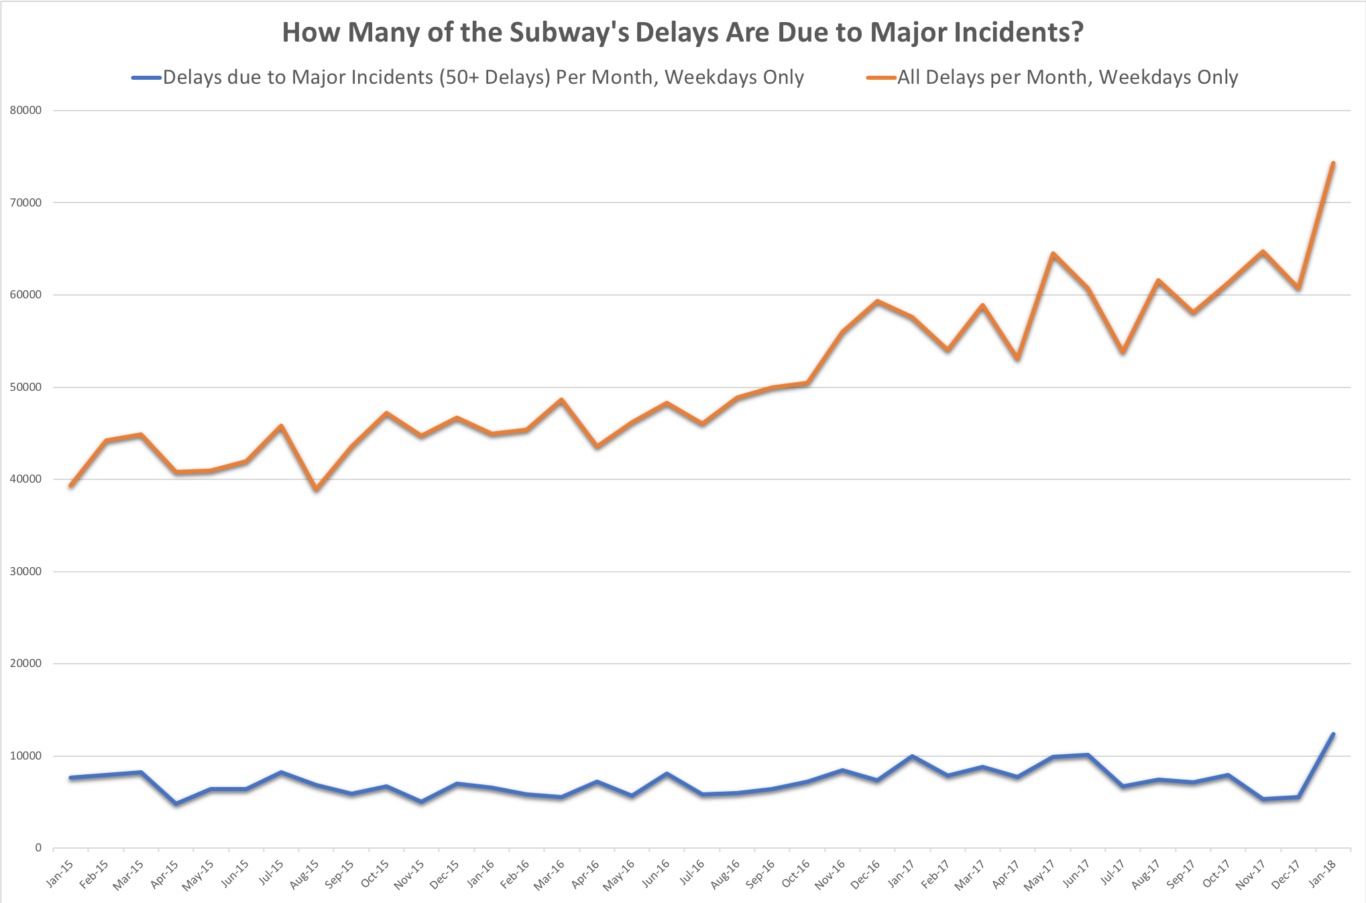
Here are the two charts from my Village Voice investigation that illustrated the point:

Above, you can see that delays attributed to no specific incident (“insufficient capacity, excess dwell, unknown”, in yellow) gradually increased from 2012 to the end of 2017, to the point where more daily delays were for unknown reasons than ones due to actual incidents (in blue; the spikes, left to right, are Hurricane Sandy, a nor’easter, and a blizzard).

In this chart of weekday delays from January 2015 through January 2018, the orange line is the number of total delays per month. The blue line represents delays due to “major incidents,” the kind explicitly targeted by the SAP. As you can see, the blue line is far lower and, more importantly, steady, particularly when compared with the orange line. Which is to say, major incidents were decidedly not the source of worse service. Something else was.
That something else, as I posited in the Village Voice article and the Times subsequently followed up on, could be most easily summarized as poor management that focused on seeking excuses for higher delay stats (such as “overcrowding”) rather than identifying what was causing them. Dysfunctional signal timers were one example, but so was general sloppiness from some train operators, dispatchers, maintenance crews, and terminal staff that resulted in many scheduled trains simply not running. In other words, NYCT fostered a culture that, at least implicitly, accepted sloppiness.
To be sure, this was not a new theory. I was far from the first to write about it, and NYCT employees/insiders had been discussing these issues on forums and in Facebook groups for years, particularly veteran train operators and dispatchers concerned with what they were seeing. But it got overshadowed by the money theory. While important in understanding the political attitude towards the MTA, the money theory doesn’t explain very many of the actual delays. However, it is simpler, familiar, and more convenient for almost everyone with a stake in the game.
The reason I’m growing increasingly confident the operational aspects are the dominant cause of subway delays is because we have something like a natural experiment in progress. For those who don’t know, NYCT president Andy Byford launched a program over the summer to clean up these operational basics led by something called the Optimal Operations Task Force. The task force is headed by Barry Greenblatt, who you can read a bit about from this New York Times Magazine article, but suffice it to say he is a widely respected authority on subway operations. The SPEED Unit, which is testing every signal timer and identifying spots for higher speed limits, is part of that task force.
“The task force oversees all of our various initiatives, including the work of the SPEED unit, effective dwell time management, accurate schedules, effective terminal management etc.” Byford wrote in an email. “While SAP is good as far as it goes in terms of fixing infrastructure, I took the strong view that we also needed to…fix operational and cultural practices that, frankly, should have been addressed years ago,” such as the speed timer issue, updated speed limits, tighter operational discipline, and so on.
“It’s not rocket science,” he summarized, “it’s how you run a subway.”
How bad was the problem? Just to take the signal timers example, after Byford instituted the first-ever testing program for the system’s 2,000 timers—which, for those who may be new around here, automatically stop a train if it’s going above the posted speed limit—NYCT found 320 of them were miscalibrated out of 95 percent tested, or about 16 percent system-wide. A miscalibrated timer causes a train’s emergency brakes to trip even when traveling the proper speed. This, in turn, leads to operators going even slower out of an abundance of caution not just across the broken signals, but most of them, because operators have no way of knowing which are functional and which aren’t. It’s a system-wide slowdown. And this is just one reason trains slowed down.
(The miscalibrated timers may sound like a maintenance issue, and on some level it is. But fundamentally, it was a management issue. The program to test/fix them costs very little and previous efforts to raise awareness of the problem hit roadblocks from middle management afraid to ruffle feathers.)
The renewed focus on running the subway is, perhaps not surprisingly, making the subway run better. Until recently, it’s been difficult to break down subway performance with publicly-available statistics because the categories listed in the board books and on the dashboard have been vague, poorly defined, and generally used to obscure subway performance rather than enlighten. Meanwhile, much more useful statistics are kept for internal purposes only.
But this, too, is getting a little better, as Byford oversaw a re-categorization effort to more accurately determine root causes of delays, which became a regular feature of the board books starting with the June 2018 stats, around the same time the focus on operational basics began.
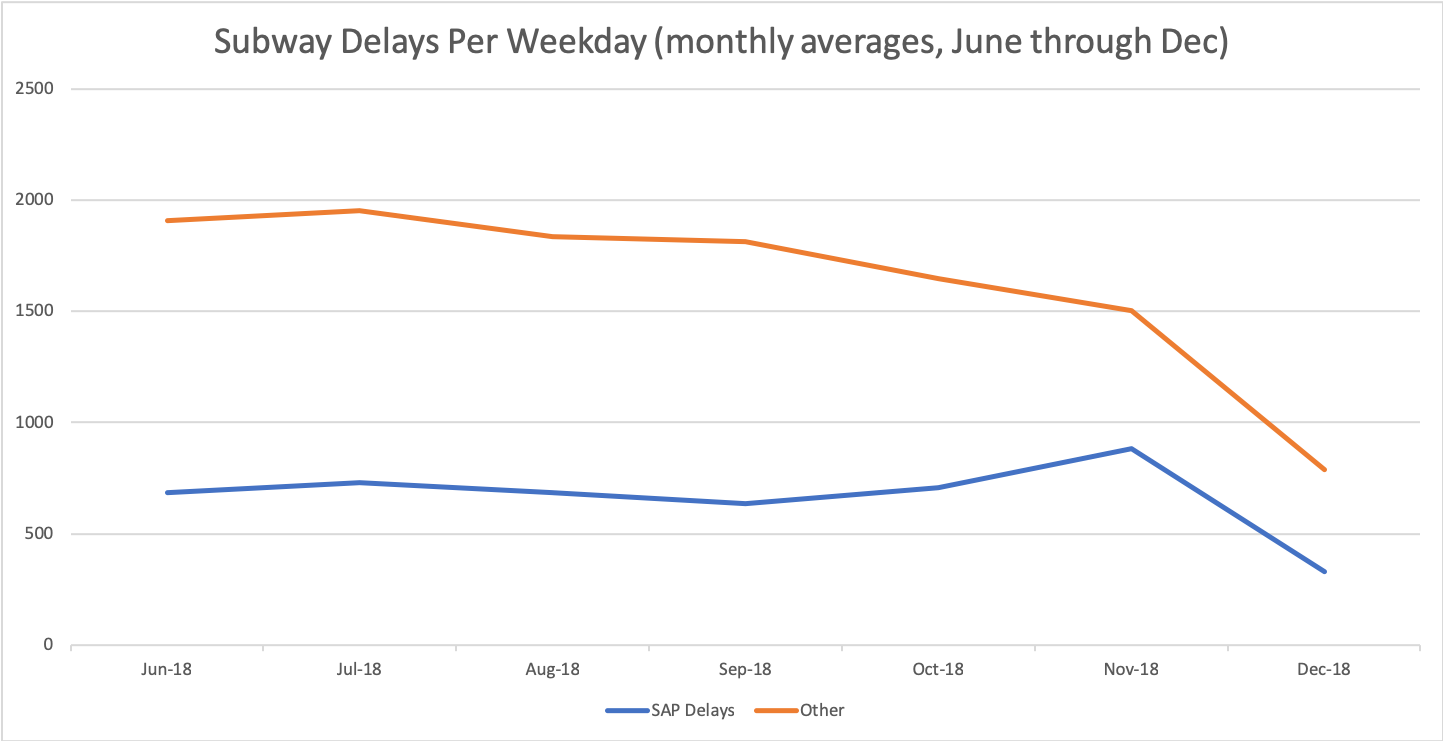
Using these new categories, I have separated delays into “SAP delays,” or the types of delays targeted by the SAP such as track, signal, and car equipment failures, with the more vague unassigned delays like “operating environment” that Byford is targeting with his Back To Basics campaign in an “other” category. (I included delays due to planned work with the “other” category because part of the Back To Basics effort has been looking at unnecessary rules and speed restrictions around planned work. I recognize, though, that this isn’t entirely fair since much of this work is in fact SAP work.)
The results are clear. From July through November, average weekday delays due to SAP categories (blue) were flat or slightly increasing, but overall subway performance was in factimproving because delays due to “Operating Environment” (ie: Byford’s Back To Basics, in orange) were falling at a higher rate. (I suspect December’s stats are an anomaly due to the fact that there were only 11 business days in the month and many workers took a great deal of the month off. The fact that LIRR and Metro-North also posted better-than-average Decembers supports this.)

Delays targeted by SAP in blue, by Back To Basics in orange. Data collected from publicly available board books.
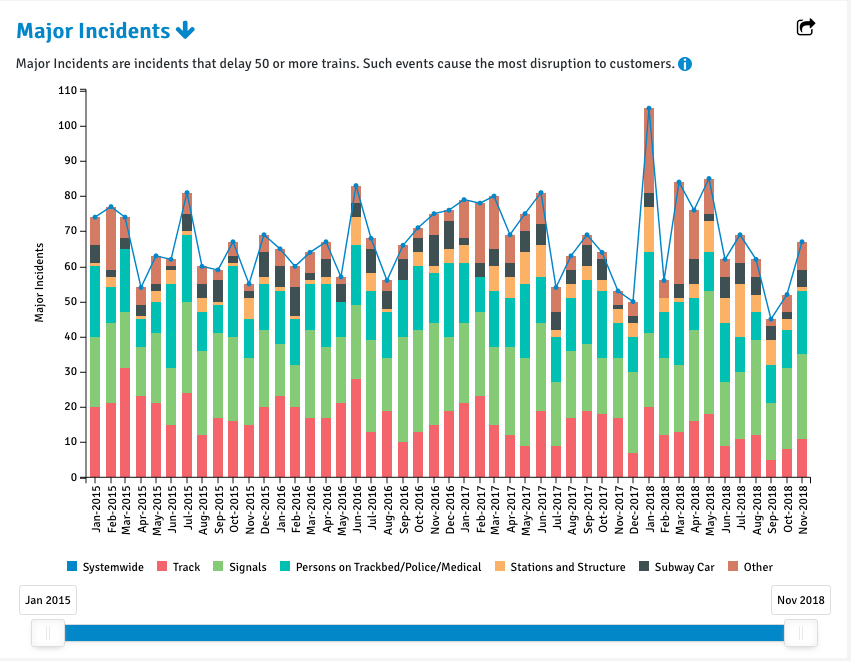
To drill down even further, the SAP’s big initiatives involved reducing delays due to track, signals, and subway cars, key targets of any maintenance program. Delays due to track failures are down by about 100 delays per weekday, give or take, versus pre-SAP, a relatively modest accomplishment considering this involved the expensive project of replacing nearly all track with continuous welded rail. Delays due to signals have dipped even less than track delays, and “major incidents” due to signals (those that delays 50 or more trains) have barely budged.
Similarly, although much is made of the deferred maintenance for subway cars, such mechanical problems account for a relatively small portion of delays—somewhere in the area of three percent of all delays—and a similarly small proportion of major incidents. Further, some of the decline in reliability can be attributed to two non-maintenance factors. Brand new cars entering service from 2005-2010 exited their “honeymoon” periods of high reliability and settled closer to the expected but still quite low failure rate. Plus the R179 model order, expected delivery starting in 2014, has still not been completed, extending the service life of 1960s-era models beyond expected.

Major incidents January 2015-November 2018. Note signals (green) barely budges despite expensive SAP initiatives and the relatively small number of major incidents due to subway car malfunctions (black) throughout.
But the bigger perspective is that reduced delays due to track, signals, and subway cars are rounding errors in comparison to the gains from Back To Basics. At the end of 2017, there were more than 2,000 delays per day assigned to Operating Environment. To be sure, some of those delays were actually caused by other incidents but not properly assigned (it is also true that NYCT took some number of those “unassigned” delays and evenly distributed them throughout every other category, something the Daily News first reported). Still, in October and November, Operating Environment delays were 941 and 888 per weekday, respectively, a reduction of about a thousand delays per day, dwarfing any result plausibly accomplished by the SAP.
One has to execute some tortured logic to argue the SAP is the cause of this improved performance. It is certainly true that many delays were misattributed to various “other” categories prior to the data cleanup. Maybe those are the delays the SAP has reduced? That doesn’t scan. It would be odd for the SAP to disproportionately reduce delays assigned to those nebulous categories while only marginally affecting the ones attributed to signals, track, or rail.
Likewise, could it be that the SAP had little effect on subway performance for more than a year and then suddenly started to yield dividends in delay categories it was not intended to target, as the MTA argues? This would be quite the coincidence, as the reduction of delays would have suddenly come to fruition at the exact moment a separate program was launched to reduce delays.
The far more logical explanation for all of this is the SAP continues to have little effect, but Back To Basics is working.
This is not to say the SAP accomplished absolutely nothing. As I wrote about a month ago:
“I’m sure the SAP accomplished some marginal goals; if you throw $836 million at a very old subway system you’re bound to hit something that needs fixing. It was spray-and-pray, carpet bombing type stuff. It was also straight from the 1980s playbook, about doing the same things we have always done to restore the subway to how it once was.”
Nor is this is an argument against any monetary investment such as say, modern signaling or significant infrastructure upgrades. In fact, several of the inefficiencies the task force has identified would be non-issues—or at least less consequential ones—with a modern signaling system that automates train speed and spacing. Moreover, the only way to truly reduce signal delays is to replace the ancient technology with modern, reliable signaling.
This also shouldn’t be misconstrued as contrary to the reporting done by the New York Times, among others, about politicians diverting money away from the MTA, saddling it with debt, and otherwise using it for purposes other than improving the city’s transportation. Those are real problems that have hurt riders.
Instead, I view this as extending that central thesis beyond funding decisions and down to the very manner in which the trains are run. The modern subway crisis is a product of the politicization of the MTA seeping into the organization’s very DNA. Only by having management no longer focused on political goals is it possible to fix the subway.
If the MTA was truly interested in fixing itself, it would be celebrating one of the most successful internal reform efforts in recent memory and holding it up as an example of what it can accomplish with the right people in charge and less political interference. But this would require an organizational mindset more focused on running trains well than utilizing the transportation authority as a political cudgel. At least for now, that is one reform we’re still waiting on.
Paid subscribers got a new edition today about the real story buried in the City Comptroller’s report on the subway. To read it, plus all past and future paid editions, subscribe now:

